Market Update: Oil & Gas - April 2016
Market Update: Oil & Gas - April 2016
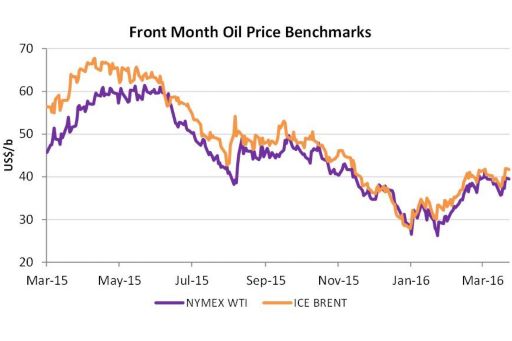
Mirroring the volatility that has shrouded the oil and gas markets over the last two years, ICE Brent prices have see-sawed in April, ranging between US$37-45/bbl.
Crude Price See-Saw
Despite oil rig count levels declining sharply and a number of North American shale producers facing bankruptcy, crude production levels remain surprisingly robust. Moreover, persisting rivalry among the oil producing powerhouses, stubbornly high US crude output and an increasingly gloomy global economic outlook, continues to linger over crude international price benchmarks.
The biggest market shifting force of the month came from Doha, where OPEC failed to negotiate a freeze of production output with non-OPEC producers. As a result, Brent Crude Futures tumbled overnight from US$44 to US41.99, and bears feel the downward price spiral may continue. With many market analysts hopeful of a production freeze, the inability to achieve a cohesive agreement has added pressure on the credibility of OPEC to lead oil producers out of the price rut.
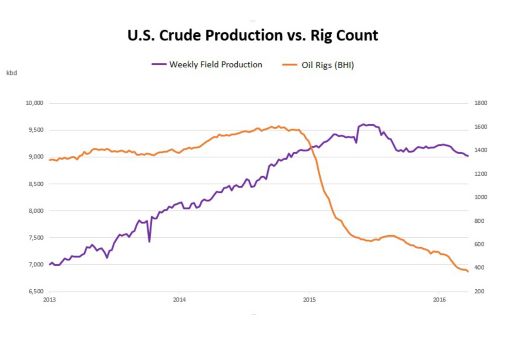
A Tale of Contrasting Dynamics: Oil Rig Count Decline; Production Climb
U.S. crude oil production has remained resilient despite a 73% decline in oil directed rig counts since 2013. Based on data supplied by Baker Hughes (BHI), the U.S. oil rig count – an important business barometer for the oil drilling and services industry - began to decline in December 2014. Within four months the count declined by 50% and nearly a further 50% a year later. The oil rig count is now at its lowest level since November 2009.
Crude production, on the other hand, continued to increase through June 2015 and, as of last month, has only declined by about 6% from the peak production level attained last year. The six month lag in production relative to the rig count decline is somewhat typical, but the scale of the crude production decline seems relatively minor compared to the magnitude of the rig count decline.
Quote:
"With U.S. crude oil stocks holding at record levels, production declines will need to accelerate to stimulate sustained increases in prompt crude prices. WTI seems to be capped at $40 for the near term."
– Thomas Ruck, Director, Market/Treasury Risk, KPMG in the US
O&G price overview
- The OPEC Reference Basket increased by more than 20% to reach US$34.65/b in March. ICE Brent ended up US$6.26 at US$39.79/b and Nymex WTI surged by US$7.34 to US$37.96/b. Speculators have amassed a near-record number of bullish bets on increasing oil prices. (OPEC)
O&G supply side headlines
- Non-OPEC supply for 2016 is forecast to contract by 0.73 mb/d, indicating downward revisions by 30 tb/d, compared with a month earlier, to average 56.39 mb/d. The main reason for this downward revision is lower expectations for crude oil production from China’s onshore mature fields in the year. (OPEC)
- Oil production in OECD Americas is projected to decline by 0.46 mb/d y-o-y to average 20.54 mb/d in 2016. The oil production outlook for this region in 2016 remains uncertain due to high break-even costs, which are estimated to be higher than current oil prices in most parts of the US and Canada as well as Mexico. (OPEC)
- Australia’s crude oil production fell by 9.1% in 2015 to 209 tb/d, the lowest level seen since 1970. (OPEC)
O&G demand side headlines
- Estimates for 2016 world oil demand have been revised lower by 50 tb/d, to reach 1.20 mb/d of projected oil demand growth for 2016. Economic developments in Latin America and China are of concern for forecasted demand. (OPEC)
- In February, oil demand in Brazil declined marginally by 16 tb/d, or around 1%, y-o-y, to average 2.34 mb/d. This decline was led by fuel oil and ethanol, which eased by around 37 tb/d each, or more than 35% and 14%, y-o-y, respectively. (OPEC)
- February oil demand growth in China was in positive territory for the second month at 0.18 mb/d. China’s oil demand strength continues to lean towards gasoline usage in the road transportation sector and LPG in the petrochemical sector. (OPEC)
- Indian oil demand continued its impressive performance in 2016, with significant growth recorded in February. It accelerated by more than 0.48 mb/d, or around 12%, y-o-y, recording the fourth-highest level of growth, resulting in total consumption reaching historical figures of around 4.59 mb/d. (OPEC)
Analyst estimates: oil
Brent forecasts have seen little movement since last month across the forecast period. Analysts maintain their prediction of a supply overhang through 2016 before the market balances in 2017, and a medium-term recovery in prices as CAPEX cuts and low spare capacity support Brent. The inventory overhang, new supply from Iran and possible demand weakness in the global economy are seen as key risks. Nothing tangible is expected to emerge from the April producer meeting.
| 2016 | 2017 | 2018 | 2019 | |
| February Avg | 42.5 | 55.4 | 70.8 | 76.7 |
| March Avg | 41.6 | 55.7 | 71.6 | 76.1 |
| February Median | 42.5 | 55.8 | 70.0 | 72.0 |
| March Median | 42.3 | 55.8 | 70.0 | 75.0 |
Analyst estimates: gas
Henry Hub forecasts have seen very little movement since last month. The market continues to be oversupplied, and this is expected to continue in the near term. Record inventory levels will be an overhang on natural gas prices through 2016, with a growing storage surplus outweighing slowing supply growth and improved gas demand.
| 2016 | 2017 | 2018 | 2019 | |
| February Avg | 2.6 | 3.0 | 3.4 | 3.6 |
| March Avg | 2.5 | 3.0 | 3.4 | 3.6 |
| February Median | 2.5 | 3.0 | 3.4 | 3.5 |
| March Median | 2.5 | 3.0 | 3.5 | 3.5 |
| 3.5 |
| 3.5 |
| 3.4 |
| 3.4 |
LNG: A Changing Energy Theatre
The global LNG market is transforming. Early in 2016, the USA started LNG exports from the Gulf Coast, a plot twist that was unthinkable even ten years ago. Australia will soon be an exporter on a scale to rival Qatar, while new importers are springing up from Panama and Lithuania to Egypt and Vietnam. LNG importers are becoming exporters and vice versa. In light of these new dynamics, we have set out six considerations for LNG sellers: Understand LNG demand holistically; segment markets by price-sensitivity and pricing basis; create demand; understand buyer’s business strategies; maintain optionality and competitiveness; and, determine a strategy for mixed LNG/pipeline exports.
Quote:
"A LNG market that is transforming, becoming more varied and increasing globalized presents all participants with challenges. Uncertainty over demand from traditionally dominant buyers requires competitiveness and eyes for new markets from LNG producers and traders. Buyers, conversely, should make the most of their current strong position, while deploying new strategies. The winners along the value-chain will be those who can act counter-cyclically, who can create and maximize markets, instead of reacting passively to them, who can identify the major long-term trends driving LNG demand, while also staying flexible to seize emerging opportunities."
– Mary Hemmingsen, Partner, Global Head of LNG, KPMG Canada
Japan: Entering an Energy Renaissance
Brent forecasts have seen little movement since last month across the forecast period. Analysts maintain their prediction of a supply overhang through 2016 before the market balances in 2017, and a medium-term recovery in prices as CAPEX cuts and low spare capacity support Brent. The inventory overhang, new supply from Iran and possible demand weakness in the global economy are seen as key risks. Nothing tangible is expected to emerge Many major Japanese oil and gas entities have fallen foul to the oil and gas price slump. In particular, a number of upstream players suffered colossal impairment loses. Indeed, INPEX recently announced an impairment loss of Yen 25.5 billion, resulting from assets in the Gulf of Mexico.
On a brighter note, as Japan continues to shake up its power market, domestic electricity and gas companies are positioning themselves for a changing environment. Capturing vast opportunities stemming from the recent deregulation of Japan’s retail power market (which began April 1, 2016) and further deregulation of power generation and transmission (that will start in 2020), will be the near-term strategic objective for many companies.
A further evolution in Japan’s energy market lies within its power and gas sector. Japanese power and gas companies are currently benefiting from lower LNG spot prices, but for the long term they are actively pursuing the diversification of global and regional gas procurement.
Quote:
"Lower fuel price is certainly a good news for Japanese consumers especially when the power retail market has now liberalized. With increased power retailers (not only incumbent utilities but now gas utilities, oil refiners, and many smaller players have entered), more reasonable price level and enhanced customer service is expected to emerge. On the other hand, higher flexibility in fuel procurement and commercial asset management are now on top of the strategic agenda of incumbent and new entrants. Reflecting this is the increasing discussion around renegotiation of their long term LNG procurement contracts and developing highly sophisticated LNG trading business."
– Tsuneo “Neo” Miyamoto, Partner, Lead oil and gas in Japan, KPMG Japan
Physical markets shortly to be caught by the European Market Abuse Regulation (“MAR”)
The EU Market Abuse Regulation (MAR) is important to the oil and gas markets; it extends the scope of market manipulation offences to spot contracts and physically settled forwards. MAR requires relevant firms to establish and maintain effective systems and procedures to detect and report suspicious orders and transactions. MAR also defines the concept of ‘inside information’ for commodity derivatives and their underlying physical markets, and introduces requirements to specify and control inside information, and to restrict trading based on inside information.
Quote:
"MiFID II has been absorbing most attention on the regulatory front; it will bring with it some far-reaching changes for oil and gas firms, but key details and its implementation date still remain uncertain. However, as a result, the impending implementation date for MAR has been pushed somewhat into the background. Companies need to be checking now their analysis on what products will be caught under new MAR, whether they have appropriate systems and controls to manage the market abuse risk and dusting down their market abuse policy / reassessing whether it is still appropriate for use to ensure they are not caught out come 3 July."
– James Maycock, Director, Commodity and Energy Markets Risk and Regulatory, KPMG in the UK